
Save millions in fuel, ETS & FuelEU across your fleet.
Voyage Tracker turns every nautical mile into measurable profit. Built by seafarers at Delta Marine Scandinavia AB — trusted by shipowners across Europe for fabrication, repair and marine performance services.
Backed by Real Maritime Experience
Voyage Tracker is developed by Delta Marine Scandinavia AB, a Swedish maritime company with more than 12 years of experience supporting shipowners, operators and technical managers across Europe.
Unlike software-only vendors, Voyage Tracker is built on real operational experience gained through vessel maintenance, repair, inspections, marine services and fleet performance projects.

From fleet data to millions saved — in three steps
Voyage Tracker turns fragmented voyage data into decisions that lower fuel spend and eliminate compliance risk. No consulting project. No 12-month rollout.
Connect your fleet
Plug in noon reports, SPEED&LOG and fuel data. We map your vessels, routes and voyage patterns into one unified operational picture — no rip-and-replace of existing systems.
- Noon reports & ingest
- GPS + fuel flow meters
- Vessel & route master data
Track every voyage
See fuel consumption, speed, weather impact, ETS exposure and FuelEU balance live — voyage by voyage, vessel by vessel. Deviations, waste and compliance risks surface automatically.
- Live fuel & CO₂ per voyage
- ETS & FuelEU exposure tracker
- Automatic deviation alerts
Save fuel & stay compliant
Captains and operators act on the same numbers. Behaviour converges toward the best performers — cutting fuel spend, ETS costs and FuelEU penalties while compliance reporting runs on autopilot.
- 3–5% fuel savings across fleet
- Lower ETS & FuelEU exposure
- Automated CII / MRV / FuelEU reporting
Calculate Your Fleet Savings
Every output line is computed from a physical mechanism — fuel tonnes saved, EUA price, FuelEU deficit cost and hours of compliance work avoided. ROI is shown net of platform cost.
4.1% identified in our reference deployment over 12 months. Default is deliberately conservative.
100% for intra-EU trading. Voyages into/out of the EU count at 50% — set accordingly.
Potential Annual Benefit
Trusted By Leading Operators
International Ferry & Logistics Operator (Name Under NDA)
Fleet: 10 vessels
- ✓4.1% Fuel Savings
- ✓€10M+ Annual Business Impact
- ✓100% Automated MRV & IMO DCS Reporting
- ✓Continuous CII Monitoring
- ✓Improved Operational Visibility
“Voyage Tracker turned twelve months of fragmented data into a single performance story we could act on at board level.”
Shipping is facing growing pressure.
- 01Fuel costs continue to rise
- 02EU ETS exposure increases annually
- 03FuelEU Maritime is now reality
- 04Compliance workload keeps growing
- 05Fleet data remains fragmented
- 06Management lacks operational visibility
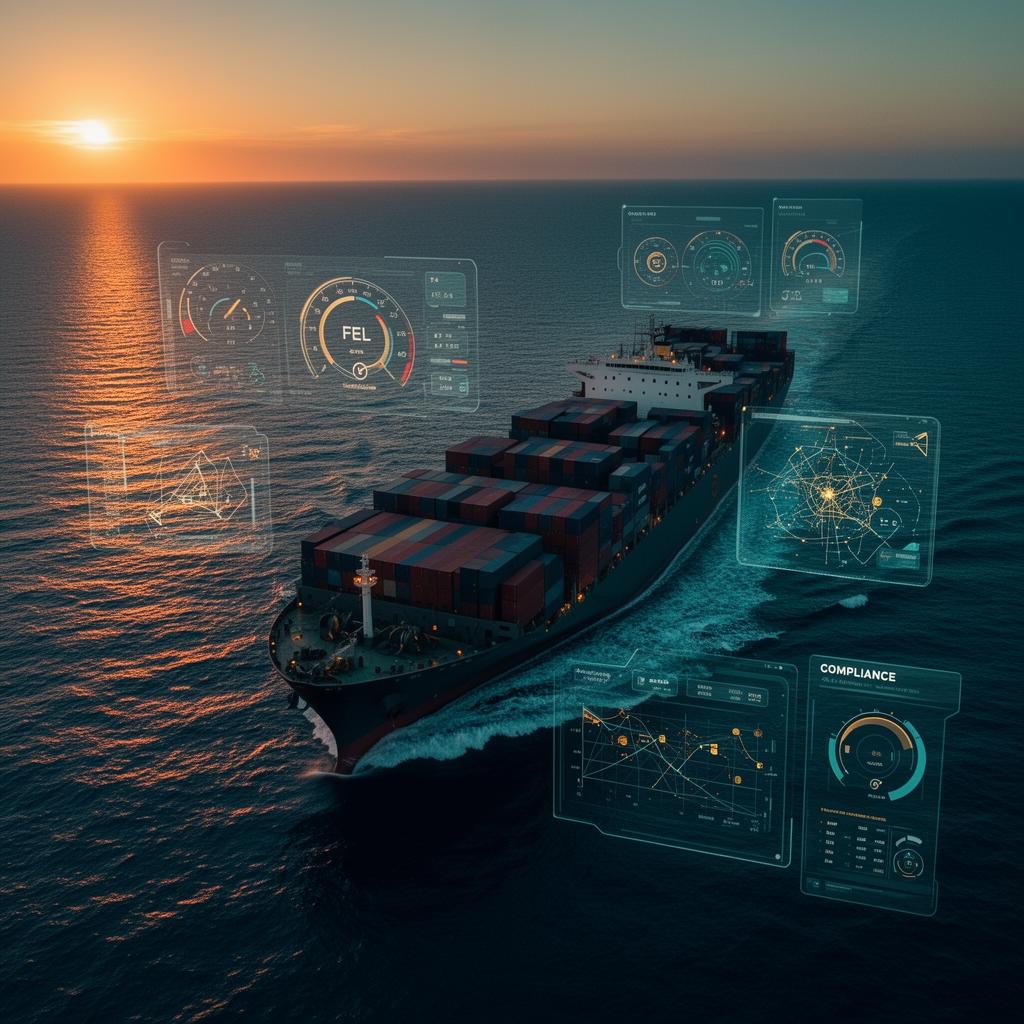
Proven operational results.
Reduce Exposure To Regulatory Costs
Fuel optimisation is only part of the business case.
Reduce emissions exposure and lower ETS-related costs.
Support compliance and reduce penalty risks.
Improve ratings and support corrective actions.
Automate reporting and reduce administrative burden.
Why Management Teams Choose Voyage Tracker
Lower bunker costs across the entire fleet.
Cut emissions-linked financial liability.
Stay ahead of penalty thresholds.
Eliminate manual MRV, IMO DCS and CII reporting.
One operational source of truth.
Turn every voyage into measurable margin.
Why fleet operators choose Voyage Tracker.
Built for captains. Valued by management.
Captains
- Fuel recommendations
- Voyage benchmarking
- CII monitoring
- Operational insights
- Route optimisation
Management
- Fuel savings
- Compliance visibility
- Profitability analytics
- Fleet-wide performance
- Regulatory readiness
Everything you need in one platform.
Reduce fuel consumption and improve voyage efficiency.
EU ETS · FuelEU Maritime · MRV · IMO DCS · CII — automated.
Benchmark vessels and surface concrete improvement opportunities.
Fleet-wide visibility and executive reporting in one view.
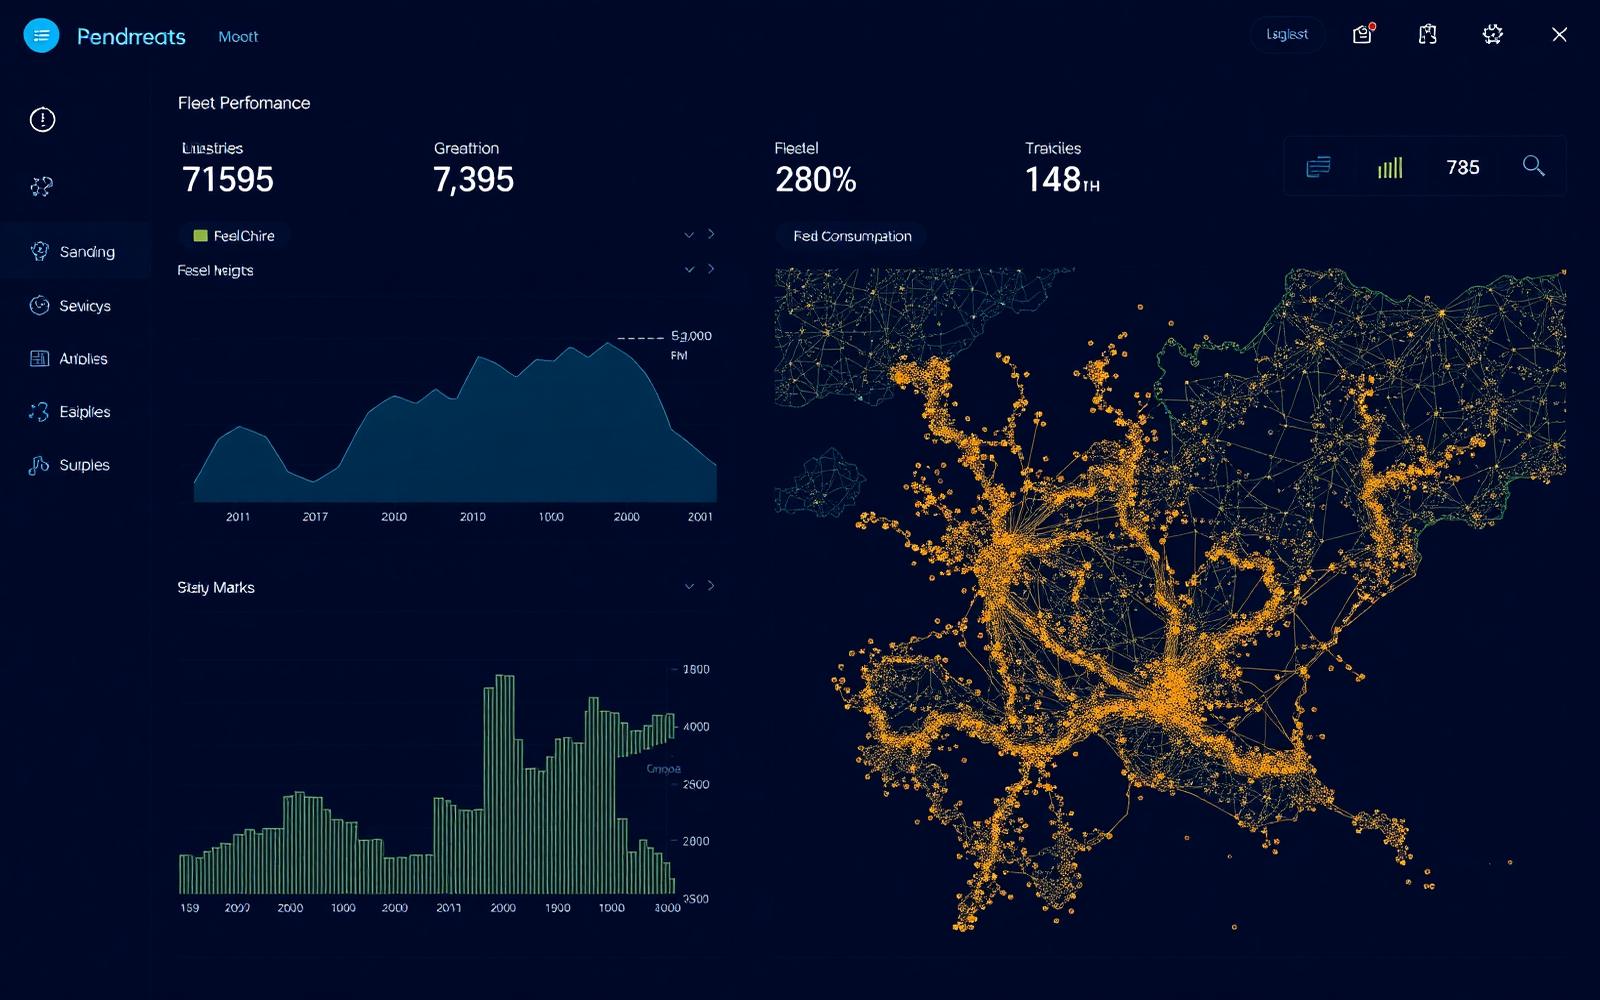
Fleet Dashboard
Real-time visibility across every vessel and voyage.
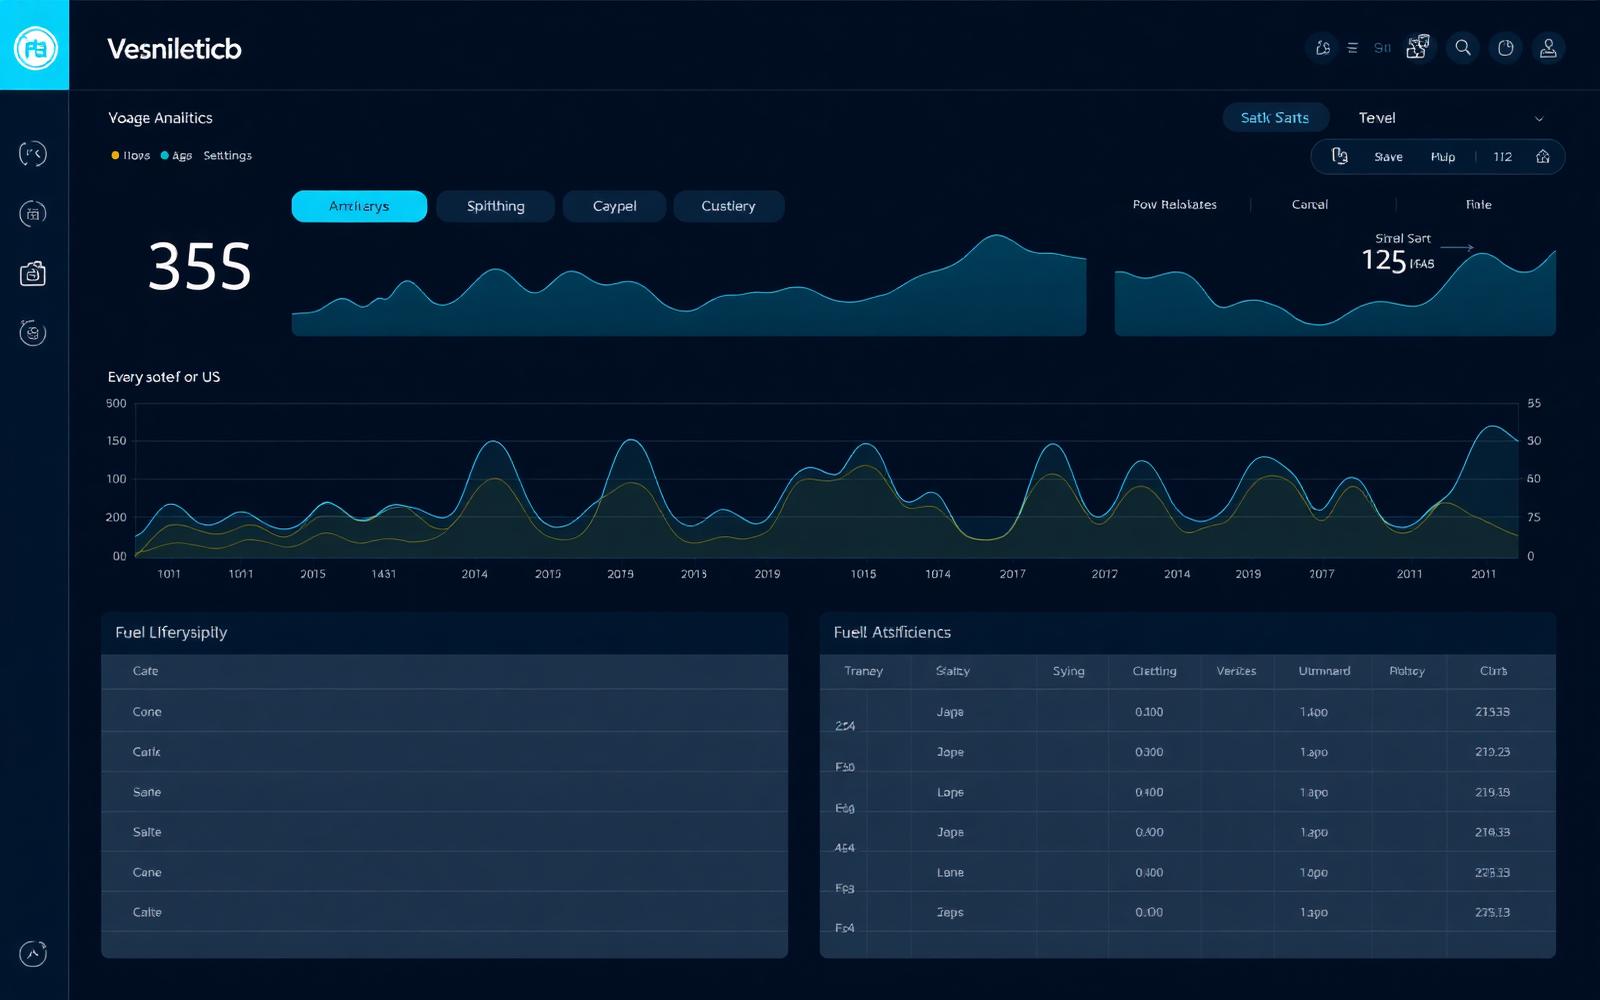
Voyage Analytics
Granular voyage-level performance against benchmarks.
Compliance Module
EU ETS, FuelEU, MRV, IMO DCS and CII — automated and audit-ready.
Built for the entire chain of command.
The cost of waiting is no longer theoretical.
Every Day Without Visibility Costs Money
Book a 30-minute demo. We'll show you your fleet's savings potential — voyage by voyage.